As an application to the windowing technique described the the previous article, John Ehlers proposed a new trend indicator that he claimed is robust and yet simple. The latter is certainly true, as the MAD (Moving Average Difference) oscillator is, as the name says, just the difference of two moving averages normalized to +/-100.
The MAD code in C for Zorro:
var MAD(vars Data, int ShortPeriod, int LongPeriod)
{
  return 100*(SMA(Data,ShortPeriod)/SMA(Data,LongPeriod)-1.);
}
Why do I do a division here instead of the supposed subtraction? It saves a function call and yields the same result, because (a-b)/b = a/b – 1.
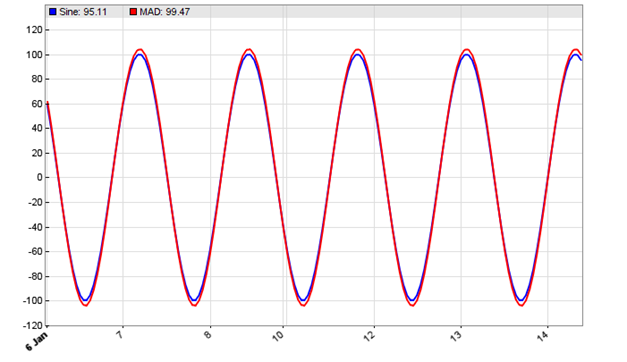
According to Ehlers, the two periods should differ by half the period of the dominant cycle in the data. This ensures that the indicator output is in phase with the dominant cycle, thus indicating its trend with no lag. For putting that to the test, we apply an SMA 5-20 difference to a 30 period sine wave (code below):
function run()
{
 MaxBars = 200;
 asset(""); // dummy asset
 ColorUp = ColorDn = 0; // don't plot a price curve

 vars Sine = series(genSine(30,30));
 var Diff = SMA(Sine,5) - SMA(Sine,20);
 plot("Sine",Sine[0]-0.5,LINE,BLUE);
 plot("MAD",Diff,LINE,RED);
}
The resulting chart:
Image may be NSFW.
Clik here to view.
The chart displays the SMA 5-20 difference (red) applied to a 30 period sine wave (blue). We can see that the red difference is indeed exactly in sync with the blue sine wave.
Now we apply the indicator to daily SPY data:
void run()
{
 StartDate = 20191201;
 EndDate = 20210701;
 BarPeriod = 1440;

 asset("SPY");
 plot("MAD",MAD(seriesC(),8,23),NEW,RED);
}
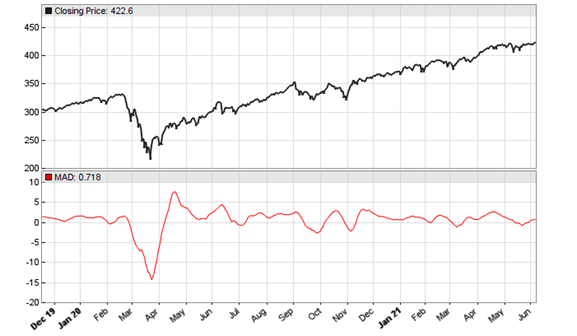
The resulting chart below matches Ehlers’ example in the S&C October issue. Note that his normalization by dividing through the longer SMA introduces a small phase shift. So the chart would look slightly different with a plain SMA difference.
Image may be NSFW.
Clik here to view.
Now let’s apply Ehlers’ Hann window technique, resulting in the MADH (MAD with Hann) indicator. We just glue both functions together:
var MADH(vars Data, int ShortPeriod, int LongPeriod)
{
 return 100*(SMA(hann(Data,ShortPeriod),ShortPeriod)
  /SMA(hann(Data,LongPeriod),LongPeriod)-1.);
}
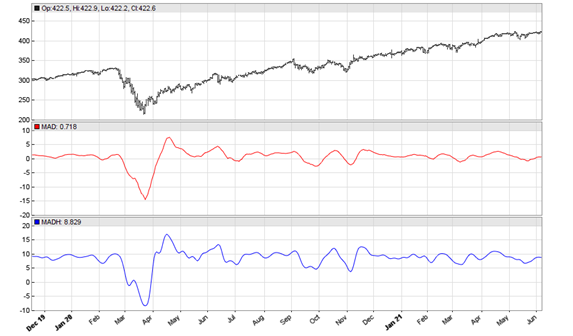
This is the script for replicating Ehler’s chart in the S&C November issue, again with daily SPY data:
void run()
{
 StartDate = 20191201;
 EndDate = 20210701;
 BarPeriod = 1440;

 asset("SPY");
 plot("MAD",MAD(seriesC(),8,23),NEW,RED);
 plot("MADH",MADH(seriesC(),8,23),NEW,BLUE);
}
The resulting chart:
Image may be NSFW.
Clik here to view.
According to Ehlers, the MADH valleys and peaks are excellent buy and sell indications. Let’s not just take his word for it, but put it to the test. For this we add some buy and sell code to the end of the run() function:
vars Signals = series(MADH(seriesC(),8,23));
if(peak(Signals))
 enterShort();
else if(valley(Signals))
 enterLong();
Well. When you backtest that code, you’ll find that the MADH valleys and peaks are anything but excellent trade conditions. I do not print the equity curve here since it’s too depressing. Interestingly, the same system with the original MAD indicator produced a better result, although still not good enough for trading with real money. So whatever the MADH may be good for, I can not recommended to trade on its peaks and valleys, at least not with SPY 2019-2021. Maybe it works better with different parameters or other filter conditions.
The MADH oscillator and test script can be downloaded from the 2021 script repository.