John Ehlers strikes again. The TASC January 2022 issue features another indicator supposedly improved with Hann windowing – the RSIH, a RSI with Hann flavour. Can it beat the standard RSI?
The RSI is basically the normalized difference of price up/down movements. And its here presented Hann variant filters the price differences with a Hann window that was described in a previous article on this blog. The RSIH code in C for Zorro is not very complex:
var RSIH(vars Data, int Length)
{
  var CU = 0, CD = 0;
  int i;
  for(i=1; i<Length; i++) {
    var D = Data[i-1]-Data[i];
    var Hann = 1-cos(2*PI*i/(Length+1));
    if(D > 0) CU += Hann*D;
    else if(D < 0) CD -= Hann*D;
  }
  if(CU+CD != 0)
    return (CU-CD) / (CU+CD);
  else return 0;
}
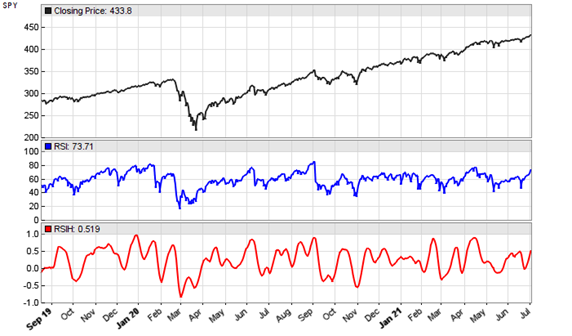
According to Ehlers, the optimal Length parameter is the dominant cycle of the price series. Here’s the RSIH (red) applied to a SPY chart, in comparison with a standard RSI (blue):

Indeed the RSIH curve looks a lot smoother and better to trade than the original RSI curve. But the usual question for any new indicator is “What can I do with it?” and as usual the indicator inventor remains silent about that. I can only say what you cannot do: replacing the RSI in a working strategy with RSIH. Even when adapting the scale and thresholds, in all RSI based strategies that I tested the RSIH produced a worse result. Maybe John Ehlers gives a practical example in a future article.
The RSIH indicator and test script can be downloaded from the 2021 script repository.