The Fisher Transform converts data to or from a Gaussian distribution. It was first used in algorithmic trading by John Ehlers (1) , and became a common part of indicators since then. In a TASC February 2022 article, Ehlers described a new indicator, the Elegant Oscillator, based on the Inverse Fisher Transform. Let’s have a look at this indicator and how it’s used in a trading system.
First, the Fisher Transform and its inverse in code:
var Fisher(vars Data)
{
  var V = clamp(Data[0],-0.999,0.999);
  return 0.5*log((1.+V)/(1.-V));
}

var FisherInv(vars Data)
{
  var V = exp(2.*Data[0]);
  return (V-1.)/(V+1.);
}
The Inverse Fisher Transform (IFT) is used in the Elegant Oscillator to convert a normalized derivative of a price series to the +/-1 range. The normalization is done by dividing by the square root of the sum of squares, a sort of N-dimensional distance. Using the IFT is supposedly a better method than simply clipping the data. The result is smoothed by Ehlers’ ‘SuperSmoother’, a low-lag lowpass filter. The Elegant Oscillator code in C for Zorro:
var EO(vars Data,int Length)
{
  vars Derivs = series(Data[0]-Data[2]);
  var RMS = sqrt(SumSq(Derivs,Length)/Length);
  var NDeriv = Derivs[0]/RMS;
  vars IFishs = series(FisherInv(&NDeriv));
  return Smooth(IFishs,20);
}
SumSq() is a helper function for summing up the squares of a data series, and Smooth() is Ehlers’ ‘SuperSmoother’ that’s already in the Zorro library. Since the FisherInv function needs only a data series of length 1, I could simply pass a pointer to the NDeriv variable instead of a series of it. For comparison, here’s the simple code for hard clipping the data:
var HardClip(vars Data)
{
  var Deriv = Data[0]-Data[2];
  vars Clips = series(clamp(Deriv,-1,1));
  return FIR6(Clips);
}
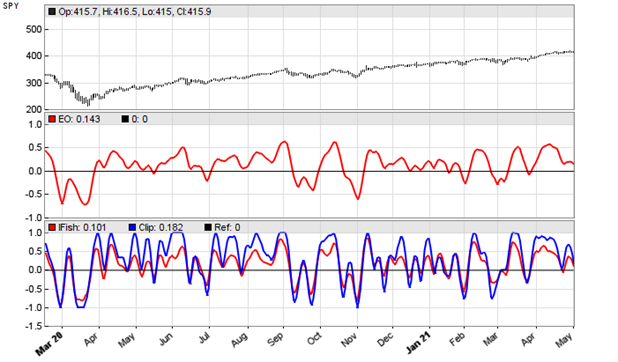
The clipped data is this time smoothed with a finite response filter (FIR6). Here’s a SPY chart with the Elegant Oscillator (upper red line), the Inverse Fisher Transform smoothed with a finite response filter (lower red line), and the hard clipped variant (blue line).

Of the 3, the super smoothed Elegant Oscillator makes the best impression and appears to generate the best signals. According to Ehlers, its peaks and valleys that exceed a threshold can be used for mean reversion trading. Let’s put that to the test. The code:
void run()
{
  StartDate = 20200301;
  EndDate = 20210501;
  BarPeriod = 1440;
  asset("SPY");
  vars Signals = series(EO(seriesC(),50));
  var Threshold = 0.5;
  if(Signals[0] > Threshold && peak(Signals))
    enterShort();
  else if(Signals[0] < -Threshold && valley(Signals))
    enterLong();
}
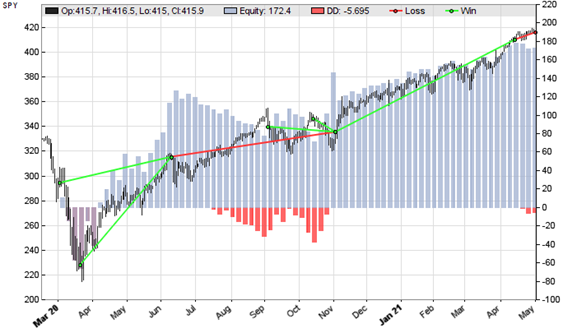
The resulting chart:

Indeed, 5 of 7 trades in that time period were winning, producing an overall positive result with a profit factor above 6. Of course, 7 trades won’t tell much, so I encorage anyone to experiment with different instruments and different time periods for determining the real value of the EO oscillator for mean reversion trading.
The oscillator and trading strategy can be downloaded from the 2021 script repository.
(1) John Ehlers, Cybernetic Analysis of Stocks and Futures, Wiley 2004